
AI-Powered Event Correlation
Take a Product TourThe customer is a mid-to-large enterprise operating a complex hybrid and multi-cloud estate spanning AWS, Azure, on-prem data centers, SaaS dependencies, and edge endpoints. Its IT operations, SRE, and NOC teams supported business-critical applications across geographies, all under demanding uptime SLAs. Over a decade of growth, mergers, and cloud migration, the organization had accumulated a sprawling stack of point monitoring tools, each producing its own alerts, dashboards, and severity definitions. What began as comprehensive visibility had quietly become operational paralysis.
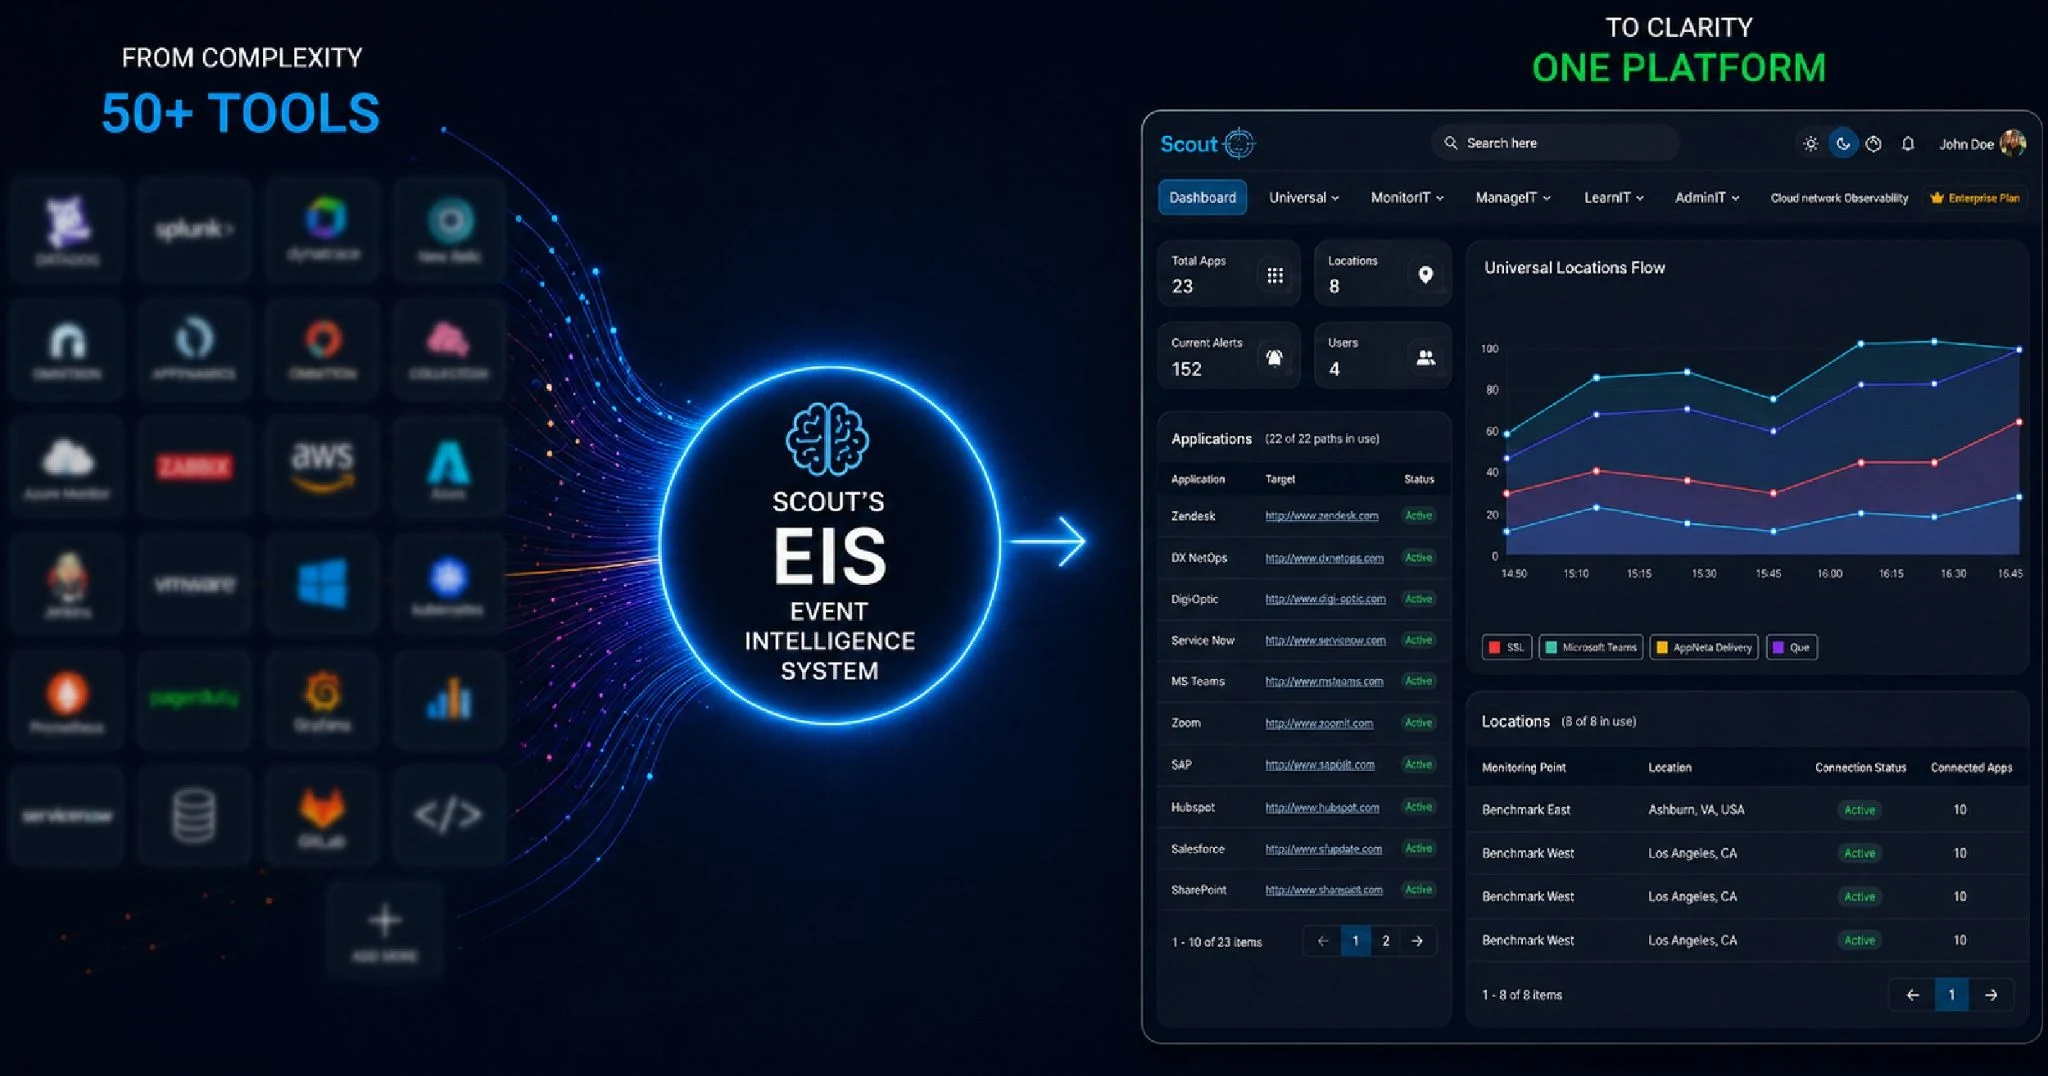
Despite a sophisticated tooling investment, the operations team was drowning in signals rather than working with them. With more than 50 monitoring, observability, log, and APM tools running in parallel, the NOC was processing hundreds of thousands of alerts per day, and a large share of them were duplicates of the same root event surfaced separately by network monitors, infrastructure agents, and application traces. False positives, stale thresholds, and cascading symptoms made it nearly impossible for engineers to distinguish meaningful incidents from background noise, and the events themselves lacked any business context, leaving a critical database CPU spike indistinguishable from a quiet test environment hiccup.
This noise translated directly into operational drag. Because analysts had to manually correlate events across disparate tools, mean-time-to-detect (MTTD) and mean-time-to-resolve (MTTR) crept steadily upward, and root-cause investigations that should have taken minutes often consumed hours. As alert fatigue set in, on-call engineers began silencing channels, ignoring tickets, and inadvertently missing genuine incidents. Leadership, in turn, lost confidence in the very dashboards that were supposed to safeguard the business. In short, the team had visibility, but no intelligence and reactive monitoring was no longer sustainable.
After looking at several AIOps and observability platforms, we picked Scout's Event Intelligence System, a custom-built platform for correlating, analyzing and prioritizing millions of infrastructure events in real time.
Unlike traditional monitoring systems, which just send out alerts, Scout's EIS ingests signals from all their existing monitoring, log, network, APM and cloud tooling, and then uses cross-domain event correlation, deduplication, contextual enrichment, anomaly detection and AI-powered noise suppression. The result? Fewer, smarter, business-aligned incidents. Crucially, the platform integrates with Scout's broader Reliability Intelligence Index (RI²) framework, taking raw telemetry data and turning it into a unified reliability score that both engineers and executives can use.
Scout's EIS was deployed alongside the customer's existing monitoring stack, with no rip-and-replace required and then progressively replaced redundant tools as confidence grew. The platform operates across five tightly coupled stages.
Step 1 - Signal Ingestion. Telemetry from network devices, applications, cloud services, logs, metrics, and traces is collected and normalized into a single event fabric.
Step 2 - AI Correlation Engine. Related events are clustered using topology awareness and dependency mapping, so a thousand symptom alerts collapse into one explainable incident.
Step 3 - Impact Analysis. Each correlated incident is mapped to the affected business service, user segment, and revenue stream so teams immediately see blast radius, not just symptoms.
Step 4 - Predictive Intelligence. Machine-learning models identify anomaly patterns and forecast likely failures before they materialize, shifting the team from reactive monitoring to proactive operations.
Step 5 - Intelligent Prioritization. Incidents are ranked by severity, SLA risk, and business impact, then routed to the right responders through automated workflows.
Together, these stages execute what the customer's CIO described as "the difference between watching alarms and understanding the system."
Within the early operational quarters, the impact was unmistakable. The most visible outcome was a 97% reduction in alert noise reaching engineers, with the suppressed signals being duplicates, transient blips, and cascading symptoms rather than meaningful events. As a result, every remaining alert genuinely warranted human attention, restoring the credibility of the monitoring layer itself. Consolidation of more than dozens of tools into a single Event Intelligence Platform simultaneously reduced licensing complexity, training overhead, and the cognitive burden of context-switching across dashboards, giving the NOC a unified pane of glass for the entire hybrid and multi-cloud estate.
The operational ripple effects followed quickly. With contextual intelligence and AI-powered root-cause analysis, on-call engineers moved from detection to remediation in a fraction of the previous time, and false escalations became rare events rather than nightly occurrences. Teams once consumed by alert triage began reinvesting their hours in reliability engineering, automation, and proactive capacity planning. Predictive intelligence flagged emerging issues well before user impact, allowing the team to remediate quietly during business hours rather than firefighting overnight, and service reliability improved measurably for the business services the team protects. Reflecting on the transformation, the customer's VP of IT Operations summarized it simply: "We used to measure success by how fast we could react. Now we measure it by how often we never had to."
Several insights emerged from the deployment that apply broadly to any CIO, SRE leader, or MSP evaluating an Event Intelligence System. Tool consolidation is necessary but, on its own, insufficient. Reducing 50 tools to one is valuable, yet the real leverage comes from the intelligence layer that interprets signals across all of them and converts them into prioritized action. Context, more than volume, is the new signal: alerts without business and topological context create noise rather than visibility, which is why event correlation, deduplication, and contextual prioritization, not raw alert counts, are the true measures of monitoring maturity in a modern operations practice.



 No credit card required
