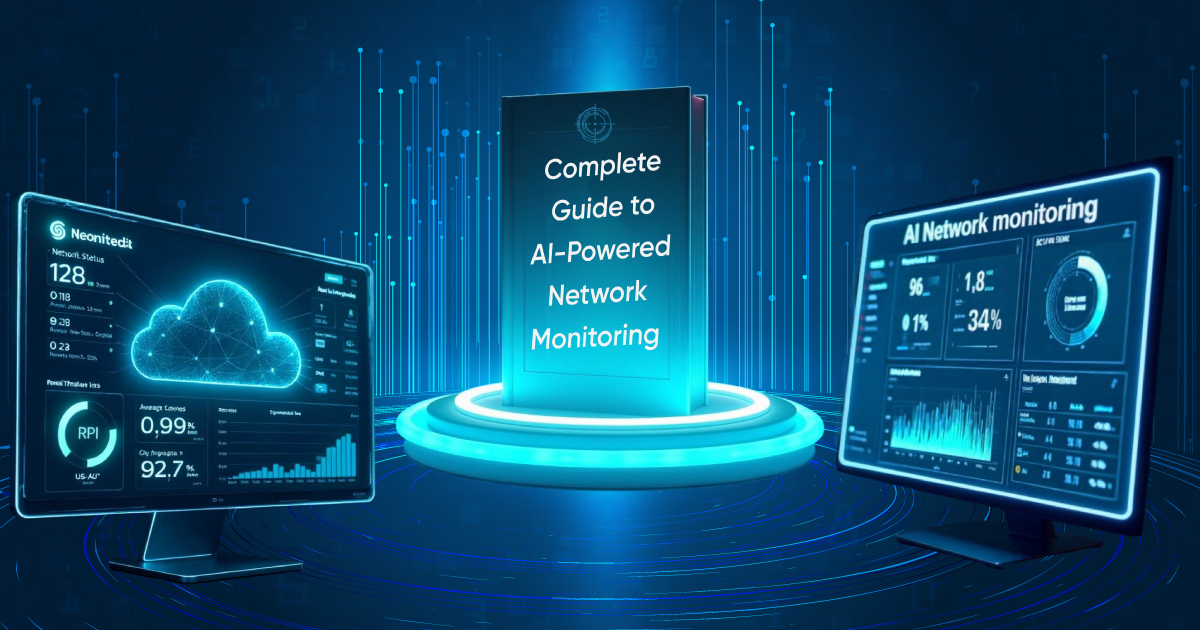
Unified dashboard for complete network insight and infrastructure metrics. Monitor everything from a single pane of glass with real-time visibility across your entire stack.
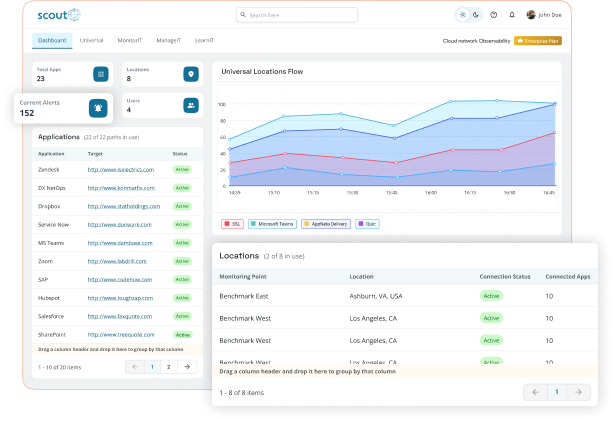
Centralize all your monitoring data with intelligent insights that drive action
Ensure a unified system view of your network's overall health and up-to-date IP spaces that visualize the number of devices per network, IPv4 used, IPv6 used, VLAN count, etc.
Track system metrics in real-time across your agency. Effortlessly view your team's performance for a specific network with the help of the device pie chart.
Get a bird's-eye view of all your networks' current issues and dependencies ensuring that every failure has an impact on only one component.
Every dashboard is customizable to your team's specific needs and workflows
Monitor your entire network infrastructure from a single dashboard. Track IPv4/IPv6 utilization, device distribution, VLAN counts, and network health metrics in real-time.
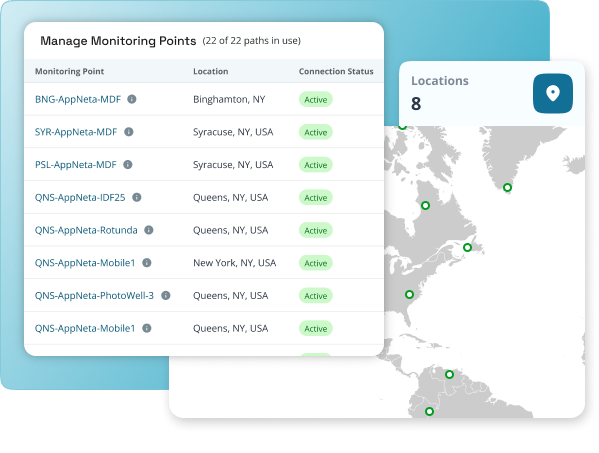
Monitor device health, performance metrics, and team productivity in real-time. Get instant alerts when issues arise and track resolution progress.
Understand how your systems interact and identify cascade failures before they impact users. Get comprehensive dependency mapping and impact analysis.
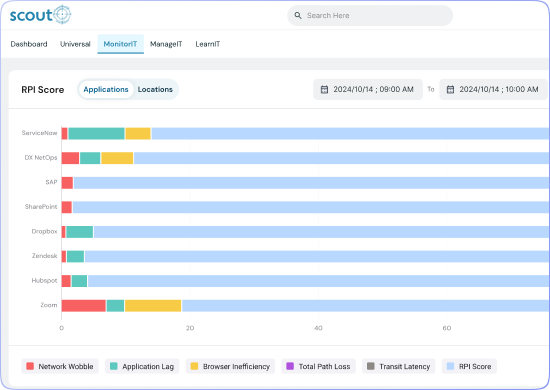
See how leading companies are using Scout to prevent outages, reduce MTTR, and deliver exceptional reliability.
Get answers to common questions about Scout and our network monitoring platform.
Scout combines AI-powered predictive insights with comprehensive infrastructure observability in one unified platform. Instead of juggling multiple monitoring tools, you get unified logs, metrics, traces, and the Reliability Intelligence Index (RI²) in a single dashboard. Our AI doesn't just alert you—it predicts issues before they happen and recommends fixes.
Scout uses advanced machine learning algorithms to analyze patterns in your infrastructure data. It learns from historical incidents, identifies anomalies, and predicts potential issues before they impact your services. The AI continuously improves its accuracy by learning from your environment's unique characteristics.
Getting started is simple. Schedule a free RI² assessment with our team, and we'll analyze your infrastructure in just 5 minutes. No credit card required. Our team will guide you through the setup process and help you integrate Scout with your existing tools.
No, Scout integrates seamlessly with your existing monitoring tools. We support integrations with popular platforms like Prometheus, Grafana, Datadog, New Relic, and more. You can use Scout alongside your current tools or gradually migrate as you see the value.
Our customers typically see significant cost savings through reduced downtime, faster incident resolution, and optimized infrastructure. Many customers report saving $1-2M annually by preventing major incidents and reducing false alerts. The exact savings depend on your infrastructure size and current monitoring costs.
Absolutely. Security is our top priority. Scout uses enterprise-grade encryption for data in transit and at rest. We're SOC 2 Type II certified and comply with GDPR, HIPAA, and other major compliance standards. Your data is never shared with third parties, and you maintain full control over your information.
Yes, Scout provides comprehensive compliance and SLA reporting features. Our platform generates detailed reports for uptime, performance metrics, and incident tracking that meet the requirements of major compliance frameworks. The Reliability Intelligence Index (RI²) gives you a single metric to track service reliability across all your infrastructure.
Explore expert-written blogs on IT monitoring, network security, and infrastructure optimization — helping your team stay ahead with the latest insights and strategies.