Introduction
Does this sound familiar? You’ve got a team running half a dozen monitoring tools at the same time, one for infrastructure, one for logs, one for APM, one for paging, but your engineers still have no idea what caused last night’s outage.
The average enterprise IT team is juggling 5 to 50 monitoring tools at once. Each tool speaks its own language, sends alerts on its own schedule, and passes along incidents with no context to speak of. The upshot is that you get alert storms, engineer burnout, and root cause investigations that should take five minutes but end up taking two hours.
This is exactly where an Event Intelligence System (EIS) comes in, designed to solve the problem that keeps you up at night. And with Gartner renaming the AIOps market to Event Intelligence Solutions in 2025, this is no longer a luxury. It’s a must-have for any team that wants to be reliable.
In this guide, we break down what an EIS actually does, how it consolidates multi-vendor monitoring tools into a single intelligent layer, and why the way it handles events fundamentally changes how IT operations teams work.
Why Your Current Monitoring Stack Is Working Against You
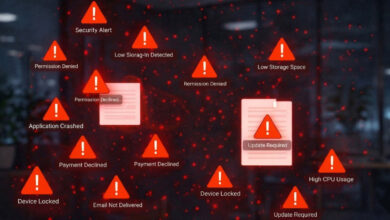
Here’s a common scenario that most IT leaders are all too familiar with: you get paged at 2 a.m. because three different tools are all firing off alerts at the same time. One says the CPU is spiking, another reports some elevated latency, and a third throws a database connection error. Are they all the same incident? Different ones? Nobody knows until someone has to manually go through logs across four different dashboards for the next two hours.
This isn’t a people problem, it’s a structural one. Most monitoring tools were designed to watch a single domain – network, application, infrastructure, or cloud – and report on everything they see. When you’ve got 5, 10, or 15 of these tools running in parallel, each one becomes a megaphone competing for your team’s attention, with no shared language, topology, or priority system in place.
It’s a problem that you can measure and quantify pretty easily. Consider what fragmented hybrid IT monitoring actually produces:
- Duplicate alerts for the same root cause: one database failure can trigger 50+ downstream alerts across dependent services, and all land in the same queue.
- No cross-tool dependency awareness: each tool sees its own domain in isolation, so the connection between a network blip and an application timeout goes undetected.
- Zero business context: alerts are IT-only signals with no mapping to which customers, transactions, or revenue streams are at risk.
- Engineer burnout as a feature, not a bug: alert fatigue is not a people problem, it’s the inevitable output of a system built to shout, not to think.
Adding more dashboards won’t solve it. Neither will hiring more engineers to keep an eye on them. The only way to break the cycle is to introduce a layer above your existing tools that actually understands relationships, not just readings. And that’s precisely the role an Event Intelligence System (EIS) plays. Rather than replacing your monitoring investments, an EIS sits above them and transforms their disconnected signals into a unified, intelligent view of your operational health.
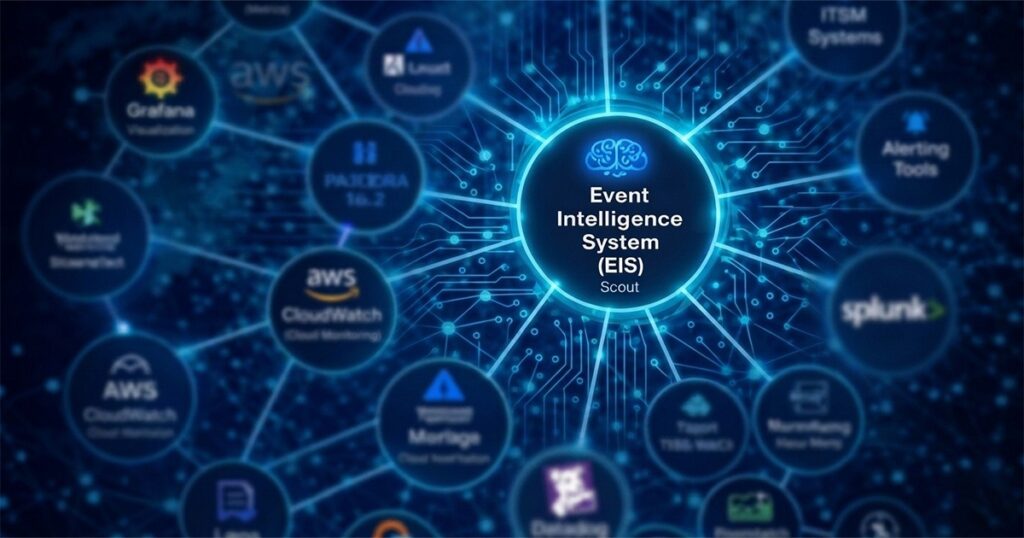
Reference Architecture: Unifying Your Monitoring Stack
The Multi-Vendor Monitoring Problem (And Why It Keeps Getting Worse)
IT teams don’t start with fragmented monitoring stacks. Tools get added one by one: a network monitor here, a cloud cost dashboard there, an APM agent after the first big outage. Before long, every team has its own toolset, nobody agrees on a single source of truth, and your on-call engineer is flipping between dashboards at 2 a.m. trying to manually correlate data.
Here’s what tool sprawl actually costs your organization:
- Alert fatigue: Hundreds of disconnected alerts per day, most of them noise or duplicates.
- Slow MTTR: Manual cross-tool correlation extends root cause analysis from minutes to hours.
- Blind spots: Events that individually look harmless but together signal a cascading failure.
- No business context: Technical alerts with no mapping to revenue impact or SLA risk.
IT operations monitoring consolidation is not just a technical preference; it’s a business survival requirement when your infrastructure spans hybrid cloud, on-prem, and multi-cloud environments.
Event Intelligence Vs Traditional Monitoring
The table below captures the core operational difference:
| Capability | Traditional Monitoring | Event Intelligence System |
| Alert volume | 200–2000+ raw alerts per day | 15–20 actionable incidents |
| Root cause time | 2–6 hours of manual correlation | Under 10 minutes with AI |
| Tool sprawl | 5–15 siloed dashboards | Single unified platform |
| Predictive capability | None purely reactive | Forecasts failures 15–30 minutes ahead |
| Business impact visibility | IT-only metrics, no revenue context | Business impact mapped in real time |
Traditional monitoring is all about reacting. Event intelligence is about stopping problems from happening in the first place. And it’s that shift in mindset that sets the best teams apart from those that are just constantly firefighting.
How an EIS Unifies Multi-Vendor Tools
Unifying alerts from all your monitoring tools isn’t just a matter of plugging everything into one big dashboard. A genuine event intelligence platform has to build on layers, and those layers have to work together seamlessly:
1. Cross Domain Event Ingestion
The EIS reaches into your whole stack, tapping into all your different tools via their own native integrations and open APIs. Network events, app logs, infrastructure metrics, cloud data, and business performance metrics all get sucked in through a single ingestion layer – and they’re all timestamped and normalized. Nothing gets left out because it doesn’t fit in with the company you bought it from.
2. Topology Assembly and Dependency Mapping
The platform lays out a real-time map of how all your services are connected to each other. When a database starts to slow down, it will instantly tell you which apps rely on that database, which users are affected and which revenue streams are at risk. You see the full picture not having to wait two hours to get a vague idea of what’s going on after a long phone call.
3. AI-Powered Event Correlation and Enrichment
AI helps to group thousands of raw alerts into a handful of real incidents you need to care about. Each incident comes with context – what changed, what it affects, what happened last time and which team is supposed to fix it. That’s real noise reduction, not just ignoring the alerts, but understanding which ones are symptoms of the same underlying issue.
4. Predictive Incident Detectiont
An Event Intelligence System isn’t just a fancy name for a traditional monitoring system. It actually looks ahead and uses historical data to forecast failures 15 to 30 minutes before they become problems for users. You get a heads-up, not just a post-mortem analysis.
5. Smart Routing and Remediation
Once an incident is identified, the EIS sends it to the right team, suggests a solution, takes action and keeps stakeholders up to speed, all without needing a human to coordinate the response for every routine issue. That means your SREs can focus on the really tough problems and not get bogged down in ticket wrangling.
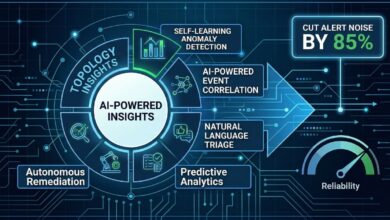
Why Scout’s Event Intelligence Platform is Built Differently
Three things make it stand out from the pack:
- It’s built on Promise Theory, so AI decisions are explainable, predictable and autonomous, not a magic black box.
- It uses an agentic AI workforce, so all the hard work of correlation, drift detection and executive summaries gets done in parallel by different AI agents, all working together without slowing down.
- There’s a Reliability Path Index (RPI) so events aren’t just correlated, they’re actually mapped into a single, simple score that everyone from executives to SREs can understand and act on.
Real Business Outcomes You Can Measure
Using an Event Intelligence System isn’t some abstract concept; teams who use Scout report:
- 85% of alerts get reduced to a handful of actionable incidents – so less noise and more signal.
- MTTR gets cut in half – so you can fix problems fast.
- False alarms get cut in half – so you’re not wasting time chasing things that aren’t actually broken.
- Predictive incident detection actually prevents outages 92% of the time -so you can actually prevent problems for your users.
Stop Drowning in Alerts. Start Preventing Incidents
The shift from traditional multi-vendor monitoring to event intelligence isn’t something to put off till next year. It’s available now. If your team is still switching between different dashboards, manually triaging alerts and reacting to problems after they’ve already hit the headlines, then an Event Intelligence System isn’t a luxury. It’s the bare minimum you need.
Scout’s EIS aggregates all your monitoring data, maps out all the dependencies, and predicts every failure so your team can stop fighting fires and actually deliver on reliability.
Ready to unify your monitoring stack? Book a free demo with Scout and see your infrastructure from one intelligent platform.
Frequently Asked Questions
An Event Intelligence System is a platform that uses AI and machine learning to take in, correlate, enrich and prioritise data from all your monitoring tools – so you can take action. Unlike traditional monitoring, which just throws up isolated alerts, an EIS groups related events into actionable incidents with root cause context and business impact mapping. Gartner actually defined this market category in 2025.
An EIS uses AI to cluster the raw alerts that are all related to the same underlying problem, so you see just one incident to deal with instead of thousands of separate alerts. And it also filters out all the cascading alerts (the ones that are triggered by downstream effects of the initial problem) and duplicates. You end up with a lot fewer alerts that are actually worth looking at.
Yes, a well-crafted EIS gets along with other stop-gaps you’ve probably thrown up to keep the lights on – like multi-vendor monitoring tools – using their own connectors and open APIs. For instance, Scout can get along with Prometheus, Grafana, Datadog, New Relic, and all sorts of other platforms – meaning you can layer some brains on top of your existing setup without having to rip it out from under you.
Gartner decided to rename the AIOps market to Event Intelligence Solutions back in 2025 as a bit of a house-keeping exercise to tidy things up. They defined EIS as applying AI specifically to all the various cross-domain events coming out of your monitoring and observability tools. AIOps had been a bit of a broad term which sometimes got mixed up with just general AI in IT, and EIS is a more exact fit for platforms that handle event ingestion, correlation and intelligent alerting.
By automating event correlation, you can quickly identify the root cause of an incident – and do it in seconds rather than hours. An EIS like Scout can understand how all your different services are inter-connected, and then use historical data to say exactly what’s going on and what you need to do – saving you the legwork of manually hunting through all your tools to figure it out.
Cross-domain event ingestion is one of Gartner’s five essential capabilities for any EIS. It basically means that an EIS can collect and normalise events from all different IT domains at the same time – like network, application, infrastructure, cloud, and business systems – and then do something useful with them in a single place. This makes it possible to do proper multi-vendor correlation.
Predictive incident detection is based on machine learning models that have been trained on loads of historical event patterns to figure out when something’s about to go wrong. A mature EIS like Scout can forecast when a potential incident is coming up 15-30 minutes ahead of time, giving teams a chance to head it off before it causes any user impact. We’ve found that with predictive analytics, we can prevent as many as 92% of outages before the customer even knows there’s a problem.
Absolutely, yes. We’ve built special multi-tenant dashboards, automated SLA reporting and white-label capabilities into the platform, all aimed specifically at Managed Service Providers. That means an MSP can use the EIS platform to manage lots of different client environments from one place – with clear visibility per client and the power of AI driven insights across all their accounts.
Scout is a real departure from the other EIS platforms out there – because we’re built around the idea of Promise Theory principles. That means the AI we use makes decisions that are not only autonomous, but can also explain what they’re doing and be held accountable for it. Our Agentic AI Workforce manages specialist agents in parallel, and we use this ‘Beehive’ swarm pattern to get the most out of the data – and all events get translated into the Reliability Path Index or RPI, which gives business-level insights that really do bridge the gap between engineering and executive stakeholders.
We’re pretty proud of how easy it is to get started with Scout.You can get up and running in under 5 minutes with a free RPI assessment and no credit card required. We also make it easy to integrate the EIS with your existing monitoring tools without having to rip out what you’ve already got. Most of our customers are already seeing a reduction in alert noise within the first week of deployment.

Tony Davis
Director of Agentic Solutions & Compliance